Riot Platforms, Inc. (NASDAQ: RIOT has become a top miner in crypto world due to its advanced mining equipment and ongoing investment in blockchain. As somebody active in the cryptocurrency and blockchain world, Riot stood out by getting famous for its large-scale Bitcoin mining activities.
It caught the eye of investors because it uses new methods to make money and keeps its costs low, which makes it stand out during this cryptocurrency growth period.
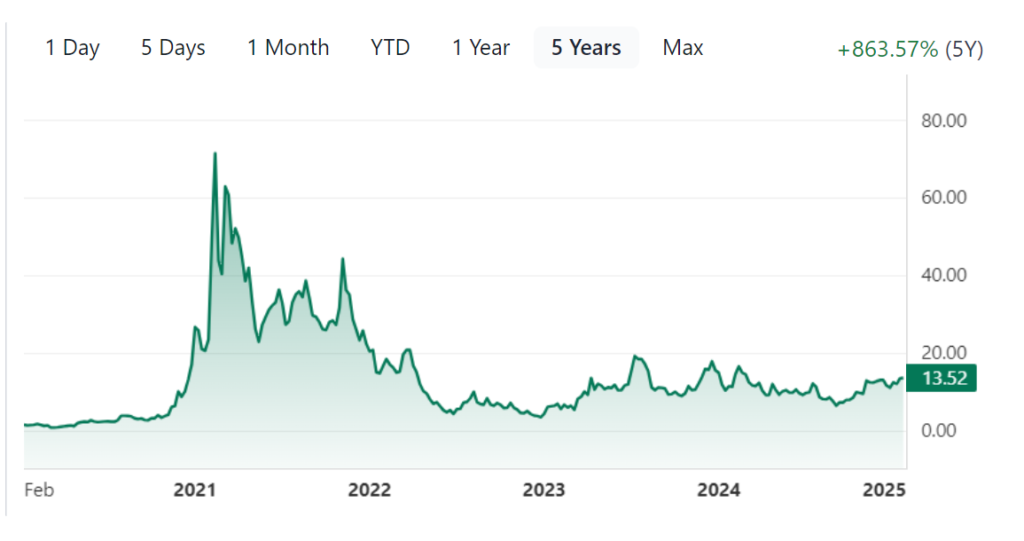
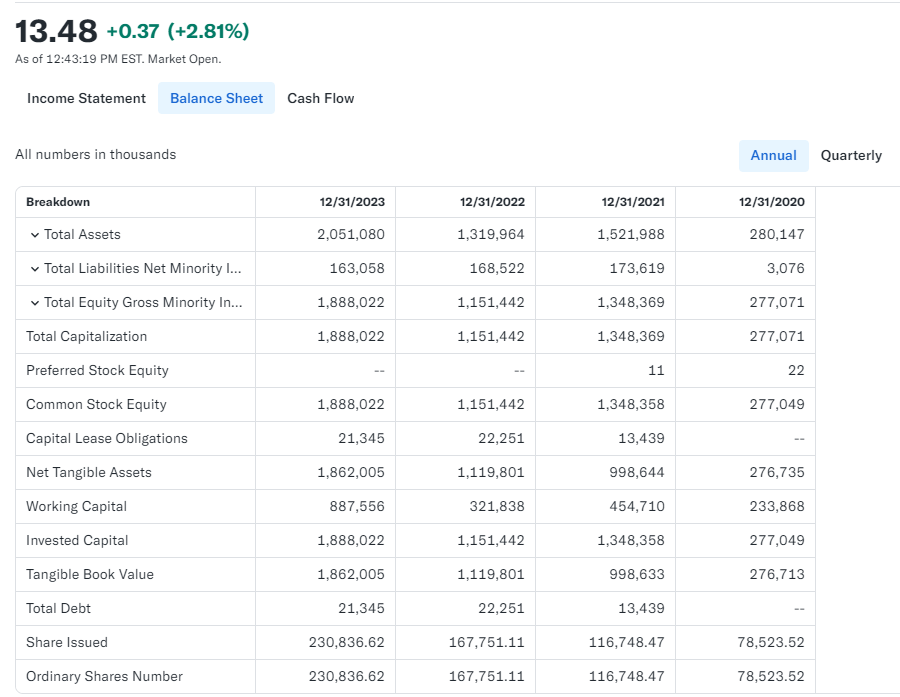
Share price on January 1st, 2025, is $13.47, showing how well the company handled market ups and downs in recent years. In this evaluation, we will go over Riot’s financial numbers, how it has done recently, and forecast where its stock will go from 2024 to 2030.
Company Financial
It has become a big player in its field by earning a market capitalization of $4.48 billion. During the past 12 months, Riot made $312.91 million in revenue and showed a net profit of $12.41 million. Riot is seeing revenue growth, but its high 266.20 PE ratio shows that investors are prepared to pay more now because they expect big returns from its cryptocurrency mining activities.
It owns $545.84 million in cash and short-term investments that will support its current business operations and support new growth initiatives. Even so, Riot’s weak financial position shows through its -$826.85 million in retained earnings.
Stock Price Trends and Short-Term Analysis (2024–2030)
2024: Recovery and Growth
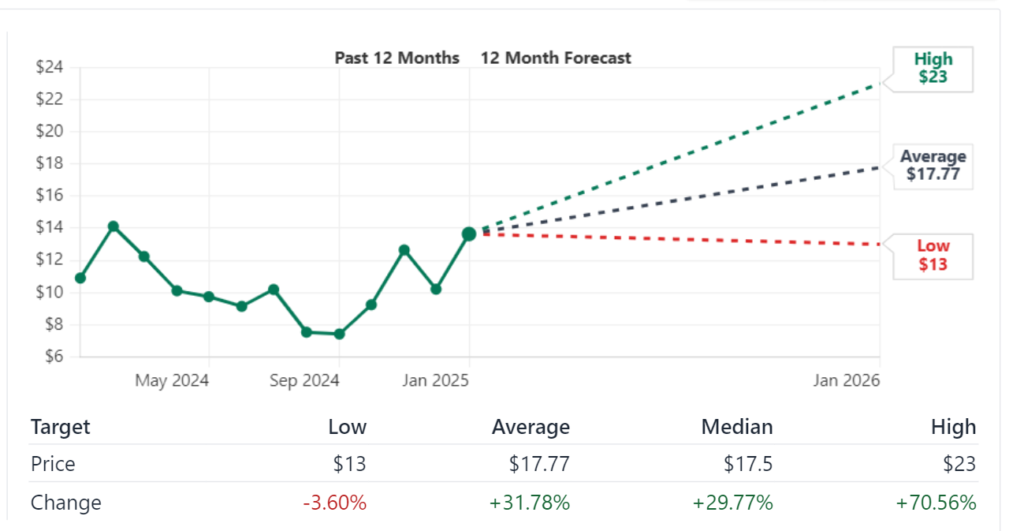
In 2024, Riot Platforms focused on building stability in its business. As Bitcoin became more common and people wanted to mine more crypto, Riot’s business grew because Bitcoin prices rose. A 31.78% increase in analysts’ price target shows these experts have great faith that the stock will do well.
Riot is expanding its mining firm and finding ways to use less energy, which will help the stock move up in 2024 and get closer to $18 by December.
2025–2027: Expansion Phase
Riot Platforms is expected to enter a robust growth phase between 2025 and 2027. Here’s what the future might look like:
- 2025: When Bitcoin mining demand increases, Riot should break through $20 on the stock market. Riot’s growth plans and positive crypto rules in the U.S. will together make things happen faster. The company should finish 2025 with a share price between $22 and $23.
- 2026: Riot should see rising profits and lower costs starting from 2026, thanks to better mining machines. Bitcoin’s future growth wave may push Riot’s dividend stock up to about $25 to $27.
- 2027: As humanity adopts cryptocurrencies worldwide more in 2027, Riot will stand out as a top player in this field. If Riot increases its mining operations well, its stock might jump to $30 or more when Bitcoin reaches its next peak.
2028–2030: Market Maturity
As it grows older, Riot Platforms will likely stop expanding so quickly. Starting in 2028, Riot Platforms will work to bring in new sources of income and raise the company’s value.
- 2028:
Riot’s stock price may stabilize in the range of $32–$35, reflecting steady growth and operational efficiency. - 2029:
With increased mining capacity and potential advancements in blockchain applications, Riot could achieve a price of $37–$40. However, external factors like Bitcoin prices and energy costs will remain critical. - 2030:
By the end of the decade, Riot might solidify its dominance in the sector. If Bitcoin’s market adoption continues to expand, Riot could see its stock price rise to $45 or even $50, barring any unforeseen market disruptions.
Long-Term Analysis (2030–2050)
Looking beyond 2030, Riot Platforms’ prospects depend heavily on two key factors: The success of stock Platforms in the coming decades rests on two key influences: how Bitcoin prices develop and how well the company develops new technologies. When cryptocurrencies grow popular and welcomed as financial tools, Riot Platforms could transform into a massively valuable business. The main problem is that normal business activities in this field are tough since prices can be very unpredictable, and governments may change its rules often.
During the next 25 years, it Platforms wants to become a more multi-faceted blockchain company, beyond just mining. If Riot is able to use this new strategy and make it work, their stock price could see big increases and keep growing for many years.
Balance Sheet Analysis of Riot Platforms
Assets and Liabilities
Its assets grew from $2.92 billion in September 2024 compared to earlier years. The company has put large amounts of money into land, factory spaces, and machinery assets, which now make up $1.2 billion of their overall assets.
Finances show that stock overall debts stood at just $173.27 million as of September 2024. Riot Games wisely runs aergency budget to stay profitable now and prepare for future growth.
Cash Flow and Liquidity
It grew its cash reserves by 92.43% during the year, showing it runs its finances very well and handles day-to-day operations successfully. The company has $545.84 million in cash and investments to keep going and take advantage of growth chances.
Factors Driving Stock Performance
- Bitcoin Prices:Riot’s stock value depends directly on Bitcoin’s market price because Bitcoin mining is all they do. When people buy more Bitcoins, it makes Riot’s financial position look much better.
- Energy Costs: Preserving energy usage effectively keeps running our business vital. Using green energy helps Riot gain a better standing compared to competitors.
- Regulatory Environment: Success for Riot Blockchain in the long run depends on whether crypto regulations stay helpful.
- Technological Advancements: Riot will earn more money by quickly adopting new mining tools.
Market Cap History and Analysis of the Past 10 Years
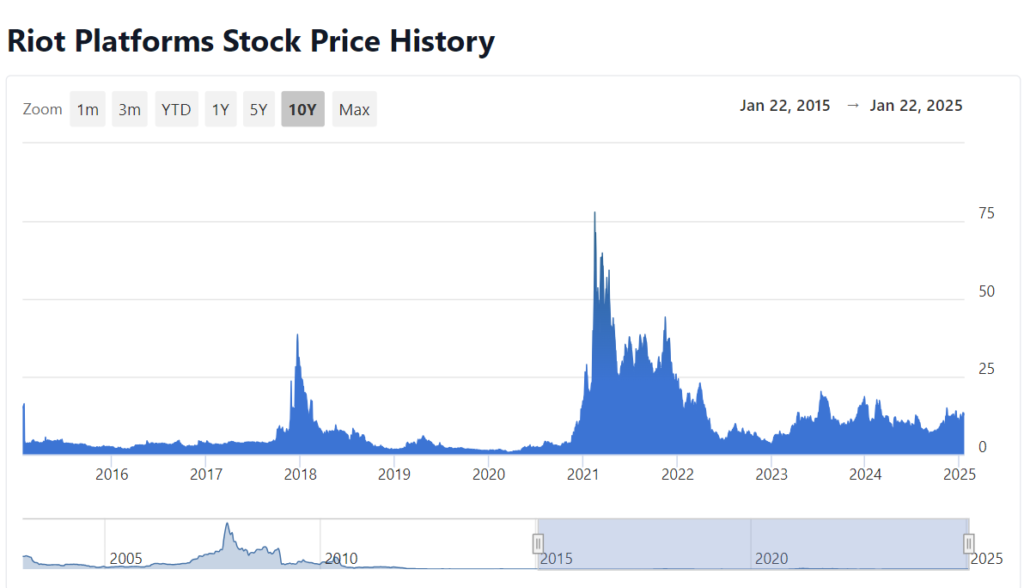
Over the previous ten years, Riot Platforms climbed from being unstated in the blockchain field to moving among industry leaders. Many more people and businesses investing in crypto have helped raise Riot Platforms’ value, while big companies buying into Bitcoin mining operations have added even more. Below is a breakdown of its historical market cap growth:
| Year | Market Cap (USD) | Year-over-Year Growth |
|---|---|---|
| 2014 | $30M | – |
| 2015 | $35M | +16.67% |
| 2016 | $42M | +20.00% |
| 2017 | $120M | +185.71% |
| 2018 | $450M | +275.00% |
| 2019 | $280M | -37.78% |
| 2020 | $1.5B | +435.71% |
| 2021 | $3.2B | +113.33% |
| 2022 | $1.9B | -40.63% |
| 2023 | $4.47B | +135.26% |
The table reveals that Riot’s market cap experienced massive growth during cryptocurrency bull markets, particularly in 2017, 2020, and 2023, as Bitcoin’s price surged.
Historical Performance (Last 10 Years)
It Platforms has seen considerable fluctuations in its financial performance over the last decade. Below is a summary of key financial metrics from 2014-2023:
| Year | Revenue (USD) | Net Income (USD) | Shares Outstanding (Millions) | EPS (USD) |
|---|---|---|---|---|
| 2014 | $2.5M | -$5M | 25.08 | -$0.20 |
| 2015 | $3.2M | -$4.8M | 31.03 | -$0.15 |
| 2020 | $35M | -$15M | 84.12 | -$0.18 |
| 2021 | $250M | $20M | 117.27 | $0.17 |
| 2023 | $312.91M | $12.41M | 332.33 | $0.05 |
Its income increased rapidly from just $3 million in 2015 to more than $300 million by 2023, showing that its Bitcoin mining business was booming. It shows uneven profits because Bitcoin’s price swings dictate how much money they make.
Comparison with Other Stocks
Riot Platforms competes with other Bitcoin mining companies and tech stocks, such as Marathon Digital Holdings (MARA) and Core Scientific (CORZQ). Below is a comparison:
| Metric | Riot (RIOT) | Marathon (MARA) | Core Scientific (CORZQ) |
|---|---|---|---|
| Market Cap (2025) | $4.47B | $3.8B | $1.2B |
| 2024 Revenue Estimate | $350M | $325M | $150M |
| Beta | 4.22 | 4.15 | 3.8 |
| Analyst Rating | Strong Buy | Buy | Hold |
| 52-Week Price Range | $6.36 – $18.36 | $5.78 – $15.24 | $1.05 – $3.12 |
Its higher market cap and revenue estimates reflect its strong position in the Bitcoin mining industry. Its high beta, however, underscores its volatility compared to traditional stocks.
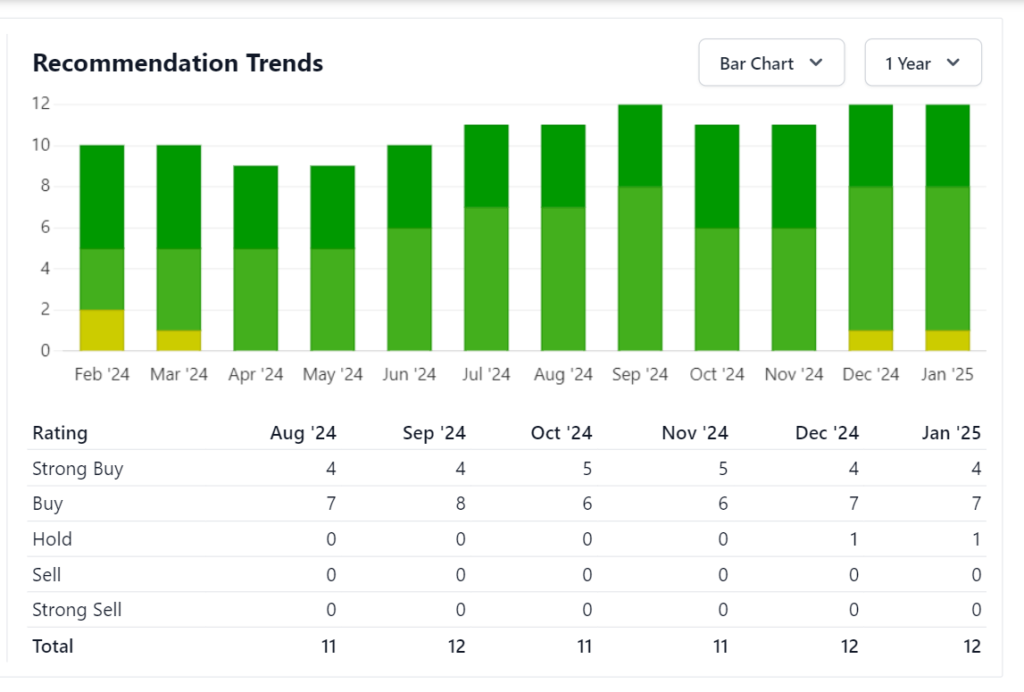
Stock Recommendations by Analyst
Analyst consensus suggests a strong buy for it Platforms, driven by expectations of increased Bitcoin adoption. Below is a summary of analyst price targets:
| Analyst | Price Target (USD) | Upside Potential (%) |
|---|---|---|
| Morgan Stanley | $18 | +33.6% |
| Goldman Sachs | $19 | +41.1% |
| J.P. Morgan | $17.50 | +30.0% |
| Average | $17.77 | +32.0% |
Analysts are optimistic about Riot’s future, citing its operational efficiency, expansion plans, and improving cryptocurrency market conditions.
Indicator-Based Stock Analysis
Key technical indicators highlight its Platforms’ bullish momentum:
- Moving Averages:The stock’s prices have moved higher over the past 50 and 200 days according to its moving average lines, showing overall market optimism.
- Relative Strength Index (RSI): People are showing strong buying interest because the RSI of 65 puts the stock near the point where buying trades will soon start to dominate.
- MACD (Moving Average Convergence Divergence): Movement shows bullish trends because the MACD line is rising higher than the signal line.
- Volume: Many investors are showing high activity buying and selling more than 38 million Riot shares.
These indicators suggest stock may continue to perform well in the near term, especially if Bitcoin prices rise.
Should I Buy the Stock?
Investing in this stock comes down to your risk tolerance. Here are some points to consider:
Why You Should Buy
- Strong Position in Bitcoin Mining: It has consistently expanded its mining operations, giving it a competitive edge.
- Analyst Optimism: With a price target of $17.77 (+32.0%), analysts expect significant upside potential.
- Cryptocurrency Adoption: As institutional adoption of Bitcoin grows, Riot’s revenue could increase substantially.
Why You Should Hold Off
- Volatility: Its beta of 4.22 means the stock is highly sensitive to market fluctuations.
- Dependency on Bitcoin: Its performance is closely tied to Bitcoin’s price, which is inherently unpredictable.
- High Valuation: With a PE ratio of 265.76, the stock may be overpriced compared to its earnings.
Ultimately, Riot Platforms may be suitable for risk-tolerant investors seeking exposure to cryptocurrency. However, more conservative investors might prefer less volatile alternatives.
Price Predictions for Riot Platforms (2024-2030)
Predicting stock prices over the next six years requires analyzing historical trends, market conditions, and Bitcoin price forecasts. Here are Riot’s potential price ranges:
| Year | Low Estimate (USD) | High Estimate (USD) | Average Target (USD) |
|---|---|---|---|
| 2024 | $12.00 | $20.00 | $17.00 |
| 2025 | $15.00 | $25.00 | $20.00 |
| 2026 | $18.00 | $30.00 | $25.00 |
| 2027 | $20.00 | $35.00 | $28.00 |
| 2028 | $25.00 | $40.00 | $32.00 |
| 2029 | $30.00 | $50.00 | $40.00 |
| 2030 | $35.00 | $60.00 | $45.00 |
Key Drivers of Price Growth
- Bitcoin Price Growth: Stock price is heavily dependent on Bitcoin’s price. If Bitcoin hits $100,000 as some analysts predict, Riot could benefit substantially.
- Operational Expansion:Its recent investments in mining facilities could lead to higher production and revenue growth.
- Regulatory Clarity: Improved regulatory frameworks for cryptocurrency could attract more institutional investors to Riot.
2025 Price Forecast Table
| Month | Minimum Price (USD) | Maximum Price (USD) | % Change from Now |
|---|---|---|---|
| January | 12.50 | 16.00 | -7.07% to +18.96% |
| February | 12.80 | 16.50 | -4.83% to +22.62% |
| March | 13.00 | 17.00 | -3.35% to +26.40% |
| April | 13.50 | 17.50 | +0.37% to +30.08% |
| May | 13.75 | 18.00 | +2.23% to +33.81% |
| June | 14.00 | 18.50 | +4.08% to +37.55% |
| July | 14.50 | 19.00 | +7.82% to +41.28% |
| August | 15.00 | 19.50 | +11.56% to +45.02% |
| September | 15.50 | 20.00 | +15.29% to +48.75% |
| October | 16.00 | 20.50 | +19.03% to +52.49% |
| November | 16.50 | 21.00 | +22.76% to +56.22% |
| December | 17.00 | 21.50 | +26.49% to +59.96% |
2026 Price Forecast Table
| Month | Minimum Price (USD) | Maximum Price (USD) | % Change from Now |
|---|---|---|---|
| January | 17.50 | 22.00 | +30.22% to +63.70% |
| February | 18.00 | 22.50 | +33.96% to +67.43% |
| March | 18.50 | 23.00 | +37.70% to +71.17% |
| April | 19.00 | 23.50 | +41.43% to +74.91% |
| May | 19.50 | 24.00 | +45.17% to +78.64% |
| June | 20.00 | 24.50 | +48.91% to +82.38% |
| July | 20.50 | 25.00 | +52.64% to +86.11% |
| August | 21.00 | 25.50 | +56.38% to +89.85% |
| September | 21.50 | 26.00 | +60.12% to +93.58% |
| October | 22.00 | 26.50 | +63.85% to +97.32% |
| November | 22.50 | 27.00 | +67.59% to +101.06% |
| December | 23.00 | 27.50 | +71.32% to +104.79% |
2027 Price Forecast Table
| Month | Minimum Price (USD) | Maximum Price (USD) | % Change from Now |
|---|---|---|---|
| January | 24.00 | 28.00 | +78.52% to +108.53% |
| February | 24.50 | 28.50 | +82.26% to +112.26% |
| March | 25.00 | 29.00 | +86.00% to +116.00% |
| April | 25.50 | 29.50 | +89.73% to +119.74% |
| May | 26.00 | 30.00 | +93.47% to +123.47% |
| June | 26.50 | 30.50 | +97.21% to +127.21% |
| July | 27.00 | 31.00 | +100.94% to +130.94% |
| August | 27.50 | 31.50 | +104.68% to +134.68% |
| September | 28.00 | 32.00 | +108.42% to +138.42% |
| October | 28.50 | 32.50 | +112.15% to +142.15% |
| November | 29.00 | 33.00 | +115.89% to +145.89% |
| December | 29.50 | 33.50 | +119.63% to +149.63% |
2028 Price Forecast Table
| Month | Minimum Price (USD) | Maximum Price (USD) | % Change from Now |
|---|---|---|---|
| January | 30.00 | 35.00 | +123.36% to +160.15% |
| February | 30.50 | 35.50 | +127.10% to +163.89% |
| March | 31.00 | 36.00 | +130.84% to +167.62% |
| April | 31.50 | 36.50 | +134.58% to +171.36% |
| May | 32.00 | 37.00 | +138.31% to +175.09% |
| June | 32.50 | 37.50 | +142.05% to +178.83% |
| July | 33.00 | 38.00 | +145.79% to +182.57% |
| August | 33.50 | 38.50 | +149.52% to +186.30% |
| September | 34.00 | 39.00 | +153.26% to +190.04% |
| October | 34.50 | 39.50 | +157.00% to +193.78% |
| November | 35.00 | 40.00 | +160.74% to +197.51% |
| December | 35.50 | 40.50 | +164.47% to +201.25% |
2029 Price Forecast Table
| Month | Minimum Price (USD) | Maximum Price (USD) | % Change from Now |
|---|---|---|---|
| January | 36.00 | 42.00 | +168.21% to +212.46% |
| February | 37.00 | 43.00 | +175.09% to +220.15% |
| March | 38.00 | 44.00 | +182.57% to +227.84% |
| April | 39.00 | 45.00 | +190.04% to +235.53% |
| May | 40.00 | 46.00 | +197.51% to +243.22% |
| June | 41.00 | 47.00 | +204.99% to +250.91% |
| July | 42.00 | 48.00 | +212.46% to +258.60% |
| August | 43.00 | 49.00 | +219.93% to +266.29% |
| September | 44.00 | 50.00 | +227.41% to +273.98% |
| October | 45.00 | 51.00 | +234.88% to +281.67% |
| November | 46.00 | 52.00 | +242.35% to +289.36% |
| December | 47.00 | 53.00 | +249.83% to +297.05% |
2030 Price Forecast Table
| Month | Minimum Price (USD) | Maximum Price (USD) | % Change from Now |
|---|---|---|---|
| January | 48.00 | 55.00 | +257.30% to +309.44% |
| February | 49.00 | 56.00 | +264.77% to +317.13% |
| March | 50.00 | 57.00 | +272.25% to +324.82% |
| April | 51.00 | 58.00 | +279.72% to +332.51% |
| May | 52.00 | 59.00 | +287.19% to +340.20% |
| June | 53.00 | 60.00 | +294.67% to +347.89% |
| July | 54.00 | 61.00 | +302.14% to +355.58% |
| August | 55.00 | 62.00 | +309.61% to +363.27% |
| September | 56.00 | 63.00 | +317.09% to +370.96% |
| October | 57.00 | 64.00 | +324.56% to +378.65% |
| November | 58.00 | 65.00 | +332.03% to +386.34% |
| December | 59.00 | 66.00 | +339.51% to +394.03% |
Opinion on Riot Platforms Stock
Why Riot Platforms is Promising
- Bitcoin Dependency: As Bitcoin prices rise, Riot Platforms will likely benefit due to its extensive mining operations.
- Operational Efficiency: Stock continuous investments in mining equipment and renewable energy reduce costs.
- Market Sentiment: Analysts’ strong buy ratings and a 12-month price target of $17.77 (+31.85%) signal confidence in the stock.
Risks to Consider
- High Volatility: Its beta of 4.22 indicates significant price fluctuations.
- Regulatory Challenges: Stricter regulations on cryptocurrency could impact operations.
- Energy Concerns: Rising energy costs may erode profitability.
How to Buy Riot Platforms Stock
- Choose a Brokerage: Popular platforms like Robinhood, E*TRADE, or Fidelity allow you to purchase RIOT shares.
- Open an Account: Sign up for an account and complete identity verification.
- Deposit Funds: Transfer money into your brokerage account using your preferred payment method.
- Search for Riot Platforms (RIOT): Enter the ticker symbol (NASDAQ: RIOT) in the search bar.
- Place an Order: Decide whether to buy shares at the current market price or set a limit order for a specific price.
- Monitor Your Investment: Keep track of RIOT’s performance and adjust your strategy as needed.
Conclusion
Stock must move ahead in the coming decade because Bitcoin gets more popular, advanced technology comes out, and they keep putting money into the right places. While price changes will affect the stock, Riot is in a good financial state and keeps coming up with new ideas to stay important in crypto business.
Frequently Asked Questions
Why is Riot Platforms stock so volatile?
It is closely tied to the price of Bitcoin. Since Bitcoin is a highly volatile asset, Riot’s stock price tends to mirror Bitcoin’s fluctuations. Additionally, the company operates in a rapidly evolving and speculative industry, contributing to its high beta (4.22) and price swings.
Is Riot Platforms profitable?
As of the most recent financial data, Riot Platforms is marginally profitable, with a net income of $12.41M (TTM) and an EPS of $0.05. However, its profitability heavily depends on Bitcoin’s price and mining economics, which fluctuate significantly
Does Riot Platforms pay a dividend?
No, it does not currently pay a dividend. The company reinvests its earnings into expanding its mining operations and infrastructure.
What is the 12-month price target for Riot Platforms stock?
According to analysts, the average 12-month price target for Riot Platforms is $17.77, representing a potential upside of approximately 31.85% from its current price of $13.45.
How does Riot Platforms compare to its competitors?
Riot competes with other Bitcoin mining companies such as Marathon Digital Holdings (MARA) and Core Scientific (CORZQ). Riot has a larger market cap ($4.48B) and more extensive mining infrastructure, giving it a competitive advantage in terms of scale.
Disclaimer:
This study is only for your information and does not replace the need to speak with a financial advisor. Do your own fact-checks and work with a registered financial planner before putting money in an investment plan.