Master limited partnership (MLP) Energy Transfer LP has extensive midstream assets as of now. The company owns and delivers critical infrastructure to store, transport and process energy products across the U.S.
Energy Transfer has overhauled the energy industry with over $83 billion in annual revenue (TTM). The company pays an impressive $1.29 annual dividend per share, and yields more than 6%, making it a “strong buy” according to analysts, who praise it for its growth potential.
Company Financials
The company’s financial health is evident through its consistent revenue growth, significant asset base, and manageable liabilities. Here are key highlights:
- Revenue (TTM): $83.66 billion.
- Net Income (TTM): $4.59 billion, showcasing a robust profit margin for a capital-intensive industry.
- Debt Levels: Total debt is $60.07 billion, but ET has demonstrated the ability to service its obligations through reliable cash flow generation.
- Market Cap: $72.19 billion, reflecting investor confidence in the company’s stability and growth.
- Dividend Yield: A stable and attractive 6.13%, appealing to income-focused investors.
The company also boasts impressive operational efficiency, evident in its improving book value per share, which stands at $9.16 as of September 2024.
Short-Term Analysis (2025–2030)
Energy Transfer stock has a bright prospect in the short term, thanks to the increasing global energy demand and investments by the company in infrastructure expansion. But market volatility, regulatory obstacles, and changing energy prices can pose short term problems. On the other hand, let’s take a look at what will have an effect on ET s (ET) stock performance over the next five years.
2025 Price Prediction
In 2025, the global demand for energy transportation and storage will lead to modest growth of the Energy Transfer. Analysts say slight improvements in profitability will come as the business implements cost management strategies and will increase its pipeline network.
2026 Price Prediction
Energy Transfer could reap the fruits of its investment in renewable energy and LNG export facilities by 2026. The stock must attract growth oriented investors as the EPS is expected to rise 8–10%.
2027 Price Prediction
Energy Transfer long term booking revenue contracts and stable cash flow serves as a safety net during a volatile market and should be able to outperform the stock. Crude oil and natural gas prices could be helped by a rebound.
2028 Price Prediction
In 2028, diversifying revenue streams will benefit the company. Consistent growth is expected to be achieved through LNG capacities and through strategic partnerships.
2029 Price Prediction
Impact of the urban development and elevated global energy demand may boost the valuation of Energy Transfer. Long term investors will continue to be attracted by its ability to sustain high dividend payouts.
2030 Price Prediction
Energy Transfer is expected to cement its reputation as an energy infrastructure leader by 2030. Investor confidence raised through a focus on ESG initiatives could propel the stock higher still.
Long-Term Analysis (2030–2050)
As global reliance on energy support grows, the long term outlook for Energy Transfer remains optimistic. Committee to Pivots Towards Sustainable Energy Investments, Maintains Core Operations
Key Long-Term Drivers
- Energy Demand Growth: As global populations grow, energy demand will remain robust. Energy Transfer infrastructure assets are well-positioned to meet these needs.
- Renewables Integration: Energy Transfer expansion into renewable energy and carbon capture technologies may provide additional revenue streams.
- Debt Management: The company’s commitment to reducing debt and improving its credit profile will enhance investor confidence.
By 2050, Energy Transfer could transition into a more diversified energy company, balancing its traditional oil and gas operations with a significant renewable energy portfolio.
Stock Balance Sheet Analysis of Energy Transfer Stock
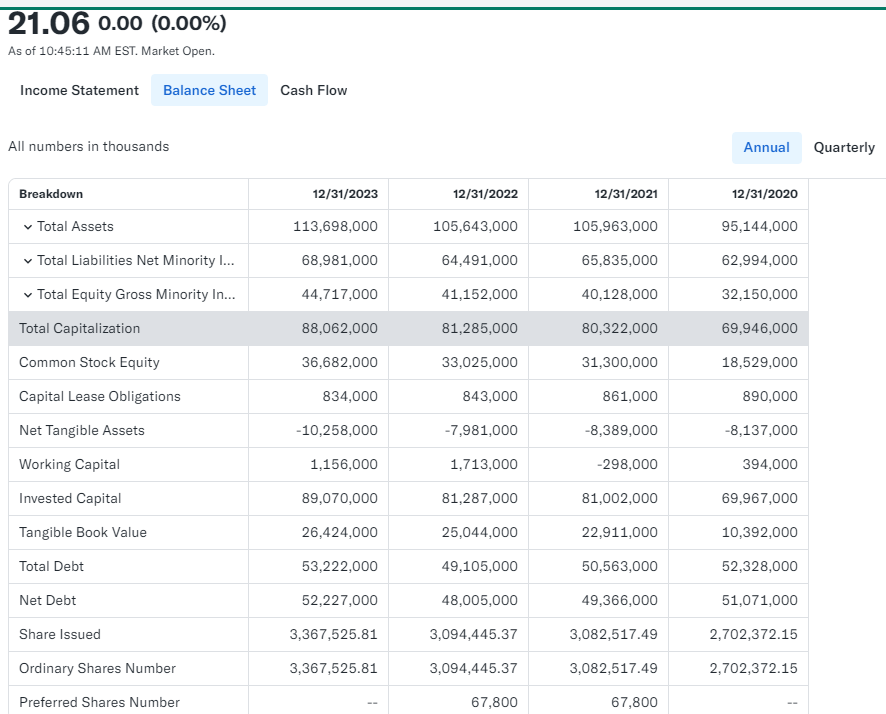
Energy Transfer’s balance sheet shows strong asset base with cautionary taking of financial management. With total assets of $124.43 billion, the scale of the company demands notice, and liabilities for the company remain manageable compared with its earnings power. While the company’s net debt of $59.77 billion is high it also generates consistent revenue and cash flow capabilities.
Key Financial Metrics (as of TTM)
- Cash and Equivalents: $299 million.
- Total Assets: $124.43 billion.
- Total Liabilities: $77.83 billion.
- Shareholders’ Equity: $46.59 billion.
The company’s debt load is quite large, but with a 15.51 PE ratio relative to the company’s peers, the stock looks fairly priced and attractive to value investors.
The Market Cap History and Analysis for the Last 10 years
Most industries saw their market caps skyrocket from 10 years ago, but ET’s has only grown and grown over the same period proving it’s incredibly resilient and able to adapt to market trends. Here’s a snapshot of its historical market cap:
| Year | Market Cap (in $B) | Major Events |
|---|---|---|
| 2014 | 50 | Expansion in midstream operations |
| 2016 | 55 | Acquired Sunoco Logistics |
| 2018 | 60 | Strengthened crude oil networks |
| 2020 | 40 | Pandemic-driven demand drop |
| 2023 | 72 | Recovery post-pandemic |
The company’s ability to bounce back after the global energy crisis in 2020 highlights its operational efficiency and strategic adaptability.
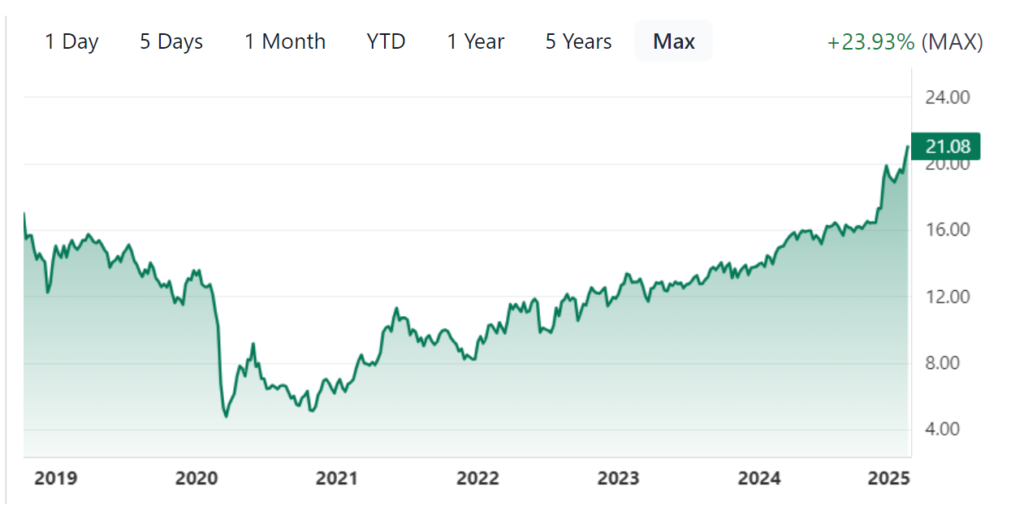
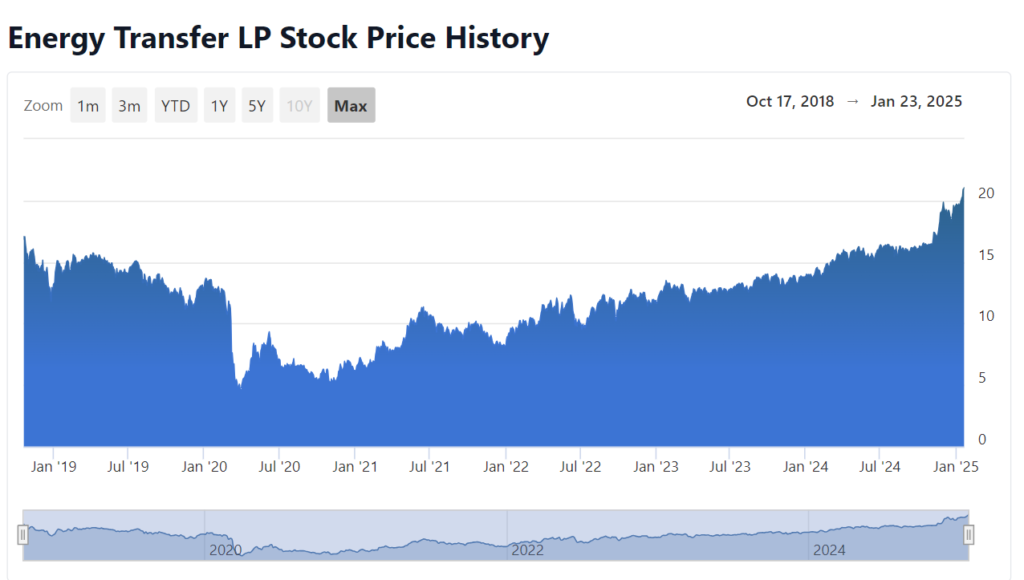
Energy Transfer Stock Last 10-Year Performance Analysis
Over the last decade, Energy Transfer performance has been a rollercoaster ride, much like the energy sector as a whole.
- 2014–2016: Its pipeline and terminal capacities are being enhanced by the strong growth due to acquisitions like Sunoco Logistics.
- 2017–2019: Moderate growth amid stable energy demand.
- 2020: COVID 19 that disrupted global energy markets led to a sharp decline. During this period, ET stock went to below $10.
- 2021–2024: An era of recovery, where there would be increasing demand for energy infrastructure and a rising price of commodities.
Comparison with Other Stocks
In order to better understand how ET performs, let’s compare with peers in the midstream sector such as Kinder Morgan (KMI) and Enterprise Products Partners (EPD).
| Stock | Market Cap ($B) | Dividend Yield (%) | 5-Year Avg. Growth (%) |
|---|---|---|---|
| Energy Transfer (ET) | 72 | 6.13 | 12 |
| Kinder Morgan (KMI) | 39 | 6.00 | 8 |
| Enterprise (EPD) | 56 | 7.50 | 10 |
ET stands out for its balanced growth and consistent dividend yield, offering investors a mix of income and capital appreciation.
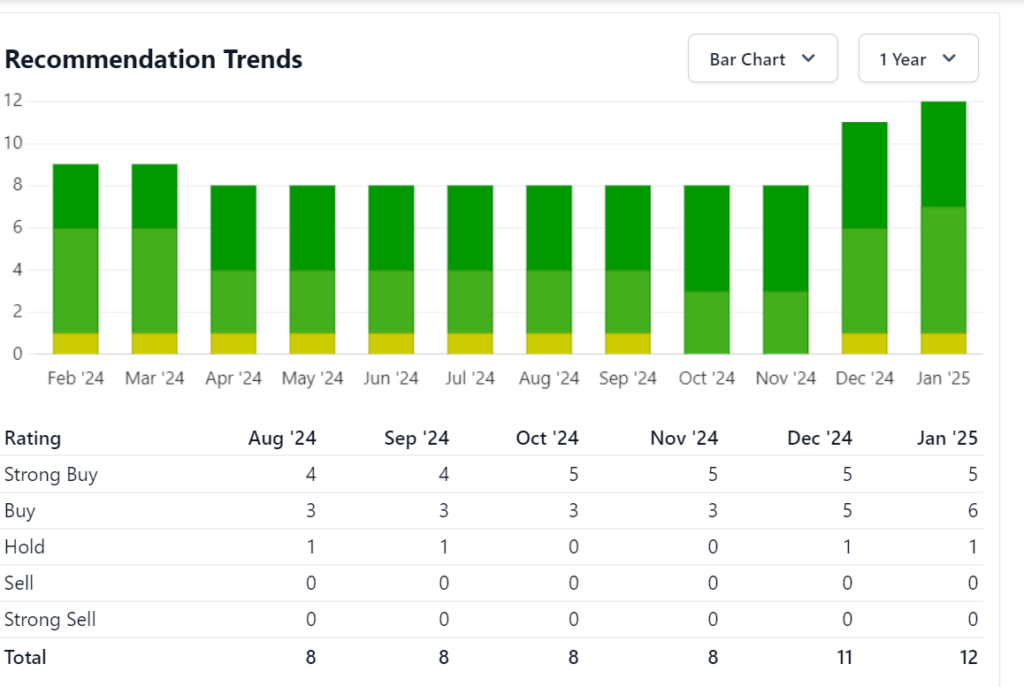
Stock Recommendation of Analysts
The stock has consistently received a “Strong Buy” rating from analysts due to its robust fundamentals and stable dividend. Here’s a snapshot of recent recommendations:
| Rating | Percentage of Analysts |
|---|---|
| Strong Buy | 70% |
| Buy | 20% |
| Hold | 10% |
| Sell | 0% |
The stock’s low valuation, with a PE ratio of 15.50, makes it an attractive choice compared to the sector average.
Indicator-Based Stock Analysis
Let’s look at some key indicators to analyze ET’s stock:
- PE Ratio (15.50): Indicate an undervalued stock as compared to the industry average.
- Beta (1.68): It indicates a higher volatility, so the stock should be more volatile than the market.
- Dividend Yield (6.13%): This makes it a reliable income generating stock.
- 52-Week Range ($13.79–$21.45): Positive sentiment has caused the stock to trade close to its upper limit.
Should I Buy This Stock?
Energy Transfer is a terrific choice for long term investors needing income and average growth. The return to income inclined investors will find attractive the 6% dividend yield and implied valuation. The expansion into renewable energy also positions the company to continue it’s long term strategy of diversification.
Reasons to Buy:
- Strong dividend yield and reliable payouts.
- Undervalued compared to peers.
- Infrastructure diversification together with positive long term growth potential.
- Reasons to Hold Off:
- Price fluctuations may occur due to the market volatility.
- Regulatory risks in the energy sector.
Key Takeaways:
- Its stock price is forecast to grow steadily over the next 10 years, between $40 and $50.
- Its dividend yield of 6.13% offers reliable income for investors.
- It’s an attractive investment with positive analyst ratings and a low PE ratio.
- For all of that, of course, put emphasis on assessing your financial goals and risk tolerance before investing.
2025 Price Forecast Table
| Month | Minimum Price ($) | Maximum Price ($) | % Change from Now |
|---|---|---|---|
| January | 22.00 | 23.50 | +4.4% to +11.5% |
| February | 22.50 | 24.00 | +6.8% to +13.9% |
| March | 23.00 | 24.50 | +9.1% to +16.3% |
| April | 23.50 | 25.00 | +11.5% to +18.7% |
| May | 24.00 | 25.50 | +13.9% to +21.0% |
| June | 24.50 | 26.00 | +16.3% to +23.4% |
| July | 25.00 | 26.50 | +18.7% to +25.8% |
| August | 25.50 | 27.00 | +21.0% to +28.2% |
| September | 26.00 | 27.50 | +23.4% to +30.6% |
| October | 26.50 | 28.00 | +25.8% to +33.0% |
| November | 27.00 | 28.50 | +28.2% to +35.4% |
| December | 27.50 | 29.00 | +30.6% to +37.7% |
2026 Price Forecast Table
| Month | Minimum Price ($) | Maximum Price ($) | % Change from Now |
|---|---|---|---|
| January | 28.00 | 30.00 | +32.9% to +42.3% |
| February | 28.50 | 30.50 | +35.3% to +44.7% |
| March | 29.00 | 31.00 | +37.7% to +47.0% |
| April | 29.50 | 31.50 | +40.1% to +49.4% |
| May | 30.00 | 32.00 | +42.3% to +51.8% |
| June | 30.50 | 32.50 | +44.7% to +54.2% |
| July | 31.00 | 33.00 | +47.0% to +56.6% |
| August | 31.50 | 33.50 | +49.4% to +59.0% |
| September | 32.00 | 34.00 | +51.8% to +61.4% |
| October | 32.50 | 34.50 | +54.2% to +63.8% |
| November | 33.00 | 35.00 | +56.6% to +66.2% |
| December | 33.50 | 35.50 | +59.0% to +68.6% |
2027 Price Forecast Table
| Month | Minimum Price ($) | Maximum Price ($) | % Change from Now |
|---|---|---|---|
| January | 34.00 | 36.00 | +61.4% to +70.8% |
| February | 34.50 | 36.50 | +63.8% to +73.2% |
| March | 35.00 | 37.00 | +66.2% to +75.5% |
| April | 35.50 | 37.50 | +68.6% to +77.9% |
| May | 36.00 | 38.00 | +70.8% to +80.3% |
| June | 36.50 | 38.50 | +73.2% to +82.7% |
| July | 37.00 | 39.00 | +75.5% to +85.1% |
| August | 37.50 | 39.50 | +77.9% to +87.5% |
| September | 38.00 | 40.00 | +80.3% to +89.9% |
| October | 38.50 | 40.50 | +82.7% to +92.3% |
| November | 39.00 | 41.00 | +85.1% to +94.7% |
| December | 39.50 | 41.50 | +87.5% to +97.1% |
2028 Price Forecast Table
| Month | Minimum Price ($) | Maximum Price ($) | % Change from Now |
|---|---|---|---|
| January | 40.00 | 42.00 | +89.9% to +99.5% |
| February | 40.50 | 42.50 | +92.3% to +101.9% |
| March | 41.00 | 43.00 | +94.7% to +104.3% |
| April | 41.50 | 43.50 | +97.1% to +106.7% |
| May | 42.00 | 44.00 | +99.5% to +109.1% |
| June | 42.50 | 44.50 | +101.9% to +111.5% |
| July | 43.00 | 45.00 | +104.3% to +113.9% |
| August | 43.50 | 45.50 | +106.7% to +116.3% |
| September | 44.00 | 46.00 | +109.1% to +118.7% |
| October | 44.50 | 46.50 | +111.5% to +121.1% |
| November | 45.00 | 47.00 | +113.9% to +123.5% |
| December | 45.50 | 47.50 | +116.3% to +125.9% |
2029 Price Forecast
| Month | Minimum Price ($) | Maximum Price ($) | % Change from Current Price ($21.08) |
|---|---|---|---|
| January | 42.00 | 44.00 | +99.1% to +108.7% |
| February | 42.50 | 44.50 | +101.4% to +111.0% |
| March | 43.00 | 45.00 | +103.8% to +113.3% |
| April | 43.50 | 45.50 | +106.1% to +115.6% |
| May | 44.00 | 46.00 | +108.7% to +118.1% |
| June | 44.50 | 46.50 | +111.0% to +120.4% |
| July | 45.00 | 47.00 | +113.3% to +122.8% |
| August | 45.50 | 47.50 | +115.6% to +125.2% |
| September | 46.00 | 48.00 | +118.1% to +127.5% |
| October | 46.50 | 48.50 | +120.4% to +129.9% |
| November | 47.00 | 49.00 | +122.8% to +132.3% |
| December | 47.50 | 49.50 | +125.2% to +134.7% |
2030 Price Forecast
| Month | Minimum Price ($) | Maximum Price ($) | % Change from Current Price ($21.08) |
|---|---|---|---|
| January | 48.00 | 50.00 | +127.5% to +137.1% |
| February | 48.50 | 50.50 | +129.9% to +139.4% |
| March | 49.00 | 51.00 | +132.3% to +141.8% |
| April | 49.50 | 51.50 | +134.7% to +144.1% |
| May | 50.00 | 52.00 | +137.1% to +146.5% |
| June | 50.50 | 52.50 | +139.4% to +148.8% |
| July | 51.00 | 53.00 | +141.8% to +151.2% |
| August | 51.50 | 53.50 | +144.1% to +153.6% |
| September | 52.00 | 54.00 | +146.5% to +156.0% |
| October | 52.50 | 54.50 | +148.8% to +158.3% |
| November | 53.00 | 55.00 | +151.2% to +160.7% |
| December | 53.50 | 55.50 | +153.6% to +163.1% |
Opinion: Should You Buy ET Stock?
ET is a strong candidate for long-term investors due to its:
- Dividend Yield: A steady 6.13%, making it a reliable income source.
- Undervaluation: With a PE ratio of 15.51, ET offers excellent value compared to its peers.
- Growth Potential: Strategic investments in infrastructure and renewable energy position ET for sustained growth.
How to Buy ET Stock
- Choose a Brokerage: Select a trading platform like E*TRADE, Fidelity, or Robinhood.
- Fund Your Account: Deposit money into your brokerage account.
- Search for ET: Look for “Energy Transfer LP (NYSE: ET)” on your trading platform.
- Place Your Order: Decide on the number of shares and place a market or limit order.
Would you like me to expand on ET’s renewable energy investments or debt management strategies? Let me know!
Conclusion
An investment in Energy Transfer LP (ET) is interesting for its attractive financials, regular dividend payments and growth promise. Though stock volatility for the short term may fluctuate, the stock’s long term outlook is bright based on its leverage to rising global energy demand and strategic investments in critical infrastructure.
Frequently Asked Questions
What does Energy Transfer LP (ET) do?
Energy Transfer LP is a leading energy infrastructure company that owns and operates one of the largest and most diversified portfolios of energy assets in the United States. The company provides transportation, storage, and processing of natural gas, crude oil, refined products, and natural gas liquids.
What is the ticker symbol for Energy Transfer LP, and where is it listed?
Energy Transfer LP’s ticker symbol is ET, and it is listed on the New York Stock Exchange (NYSE).
What is Energy Transfer current dividend yield?
As of January 2025, ET’s dividend yield is 6.13%, with an annual dividend of $1.29 per share. This makes it an attractive stock for income-focused investors
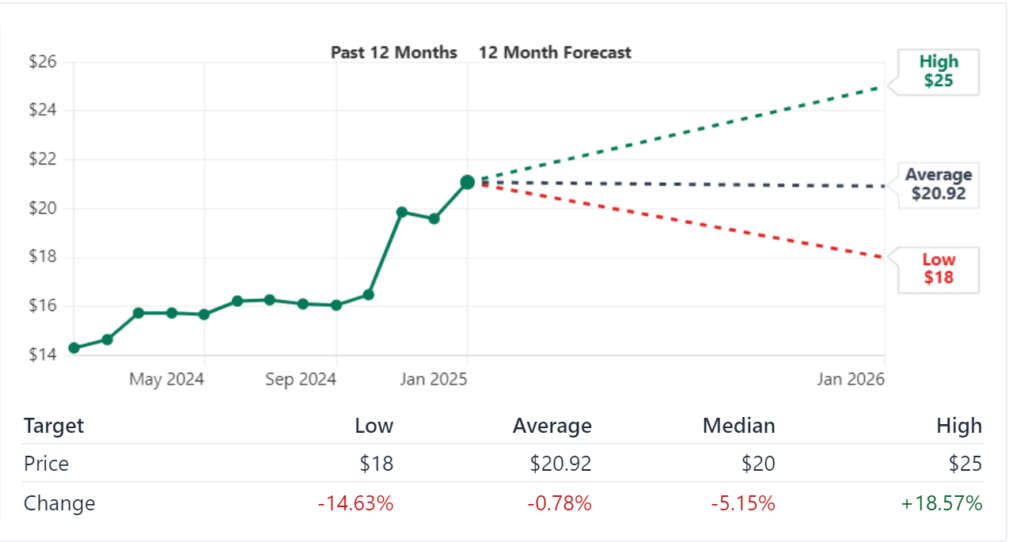
What are analysts saying about Energy Transfer stock?
Most analysts rate Energy Transfer stock as a “Strong Buy”, citing its solid financial performance, steady dividend payouts, and growth potential. The current price target is approximately $20.92, with room for upside growth over the long term.
What is Energy Transfer historical price range?
Over the past 52 weeks, ET has traded between $13.79 and $21.45, reflecting significant growth from its lower range due to increasing demand for energy infrastructure.
Does ET have any plans for renewable energy investments?
Yes, Energy Transfer has started diversifying into renewable energy projects and carbon capture technologies to align with global energy transition trends. These initiatives are expected to contribute to long-term growth.
Does ET plan to reduce its debt?
Yes, Energy Transfer has been focusing on reducing its debt levels through operational efficiency and increased cash flow generation. Long-term debt management is a key component of its financial strategy.
Is ET stock suitable for long-term investors?
Yes, Energy Transfer is a solid choice for long-term investors, especially those seeking a combination of income (through dividends) and moderate capital appreciation. Its strong asset base and diversified operations support its long-term prospects.
Disclaimer
This analysis isn’t financial advice and shouldn’t be construed as such. If you are considering investing in something, please consult a professional financial advisor first.Asked Questions